


Introduction
TA-Lib makes it easy to create indicators for technical analysis on stock prices, FX, and virtual currencies.
This article describes how to use such TA-Lib with google coalb. We will use yahoo_finance_api2 for stock price data and mplfinance for data plotting.
In addition, you can try the code in this article here.

Install TA-Lib and necessary libraries
Installing TA-Lib
TA-Lib is installed by downloading the necessary packages from https://sourceforge.net/projects/ta-lib/, not by pip installation. Specifically, run the following command in google colab to complete the TA-Lib installation.
!curl -L http://prdownloads.sourceforge.net/ta-lib/ta-lib-0.4.0-src.tar.gz -O && tar xzvf ta-lib-0.4.0-src.tar.gz
!cd ta-lib && ./configure --prefix=/usr && make && make install && cd - && pip install ta-lib
Installation of yahoo_finance_api2
The library yahoo_finance_api2 allows you to retrieve stock quotes from Yahoo Finance. This library is installed via pip installation.
!pip install yahoo_finance_api2mplfinance
Finally, mplfinance is installed. This is a library that makes it easy to draw candlesticks.
!pip install mplfinanceThis completes the installation of the required libraries.
Try it out for yourself
This time, we will be doing the following.
- Get Google stock quotes using yahoo_finance_api2
- Create appropriate indicators using TA-Lib
- Plot data using mplfinance
First, import the necessary libraries.
import talib
from yahoo_finance_api2 import share
import pandas as pd
import mplfinance as mpf
Now, let’s first try to obtain stock prices using yahoo_finance_api2.
# Get Google's stock price
my_share = share.Share('GOOG')
ohlcv = my_share.get_historical(
    share.PERIOD_TYPE_YEAR, 1,
    share.FREQUENCY_TYPE_DAY, 1)
df = pd.DataFrame(ohlcv)

df['timestamp'] = pd.to_datetime(df['timestamp'].astype(int), unit='ms')
df.set_index("timestamp", inplace=True)
df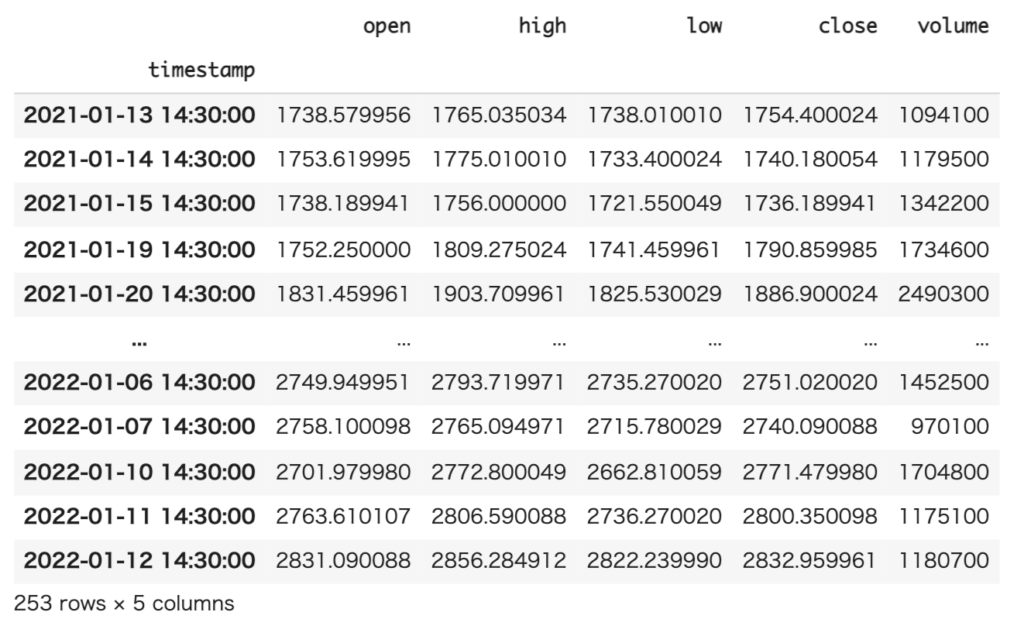
Once the stock price is obtained, create an appropriate indicator using TA-Lib. In this case, we created SMA and EMA.
A list of other indicators that can be created can be found here.
df['SMA'] = talib.SMA(df['close'], timeperiod=5)
df['EMA'] = talib.EMA(df['close'], timeperiod=5)
df.dropna(inplace=True)
df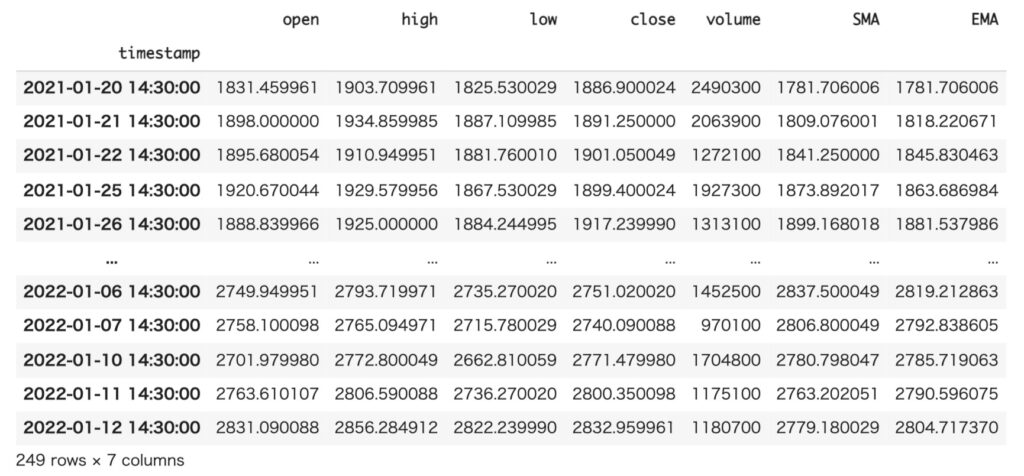
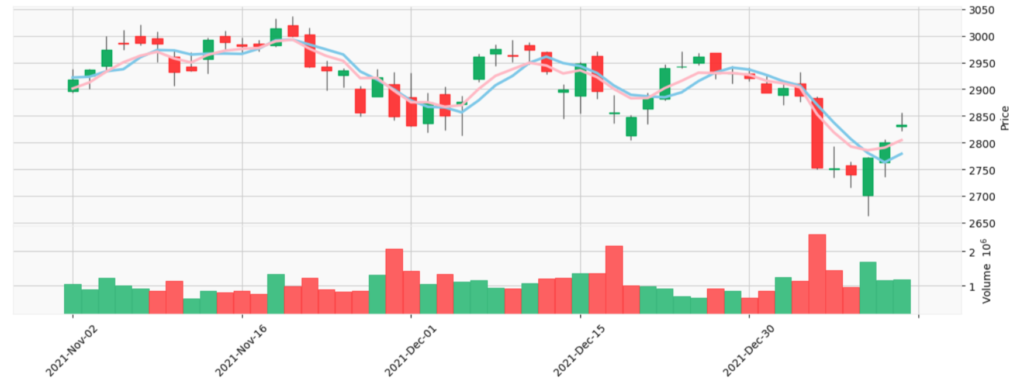
Finally, the data is plotted using mplfinance.
term = -50

indicators = [
    mpf.make_addplot(df['SMA'][term:], color='skyblue', width=2.5),
    mpf.make_addplot(df['EMA'][term:], color='pink', width=2.5),
]

mpf.plot(df[term:], figratio=(12,4), type='candle', style="yahoo", volume=True, addplot=indicators)